All Digital Chart Recorder!
- Four wireless temperature/ RH sensors
- Monitors any temperature or RH
- Accuracy ©0.3©and ©3.0%
- Over 320,000 data points
- Displays a continuous chart
- Easy-Touch™LCD display
- Installs in minutes
- Auto downloads to computer
- Audible and visual alarms
- Phone call or email alert
- 40 hour battery backup
- All functions operate on battery
Wireless Sensors
This paperless TV2 uses temperature only or wireless temperature/RH sensors to sample, log and chart temperature and humidity on the Easy-Touch™LCD. Sensors for any temperature range are available.
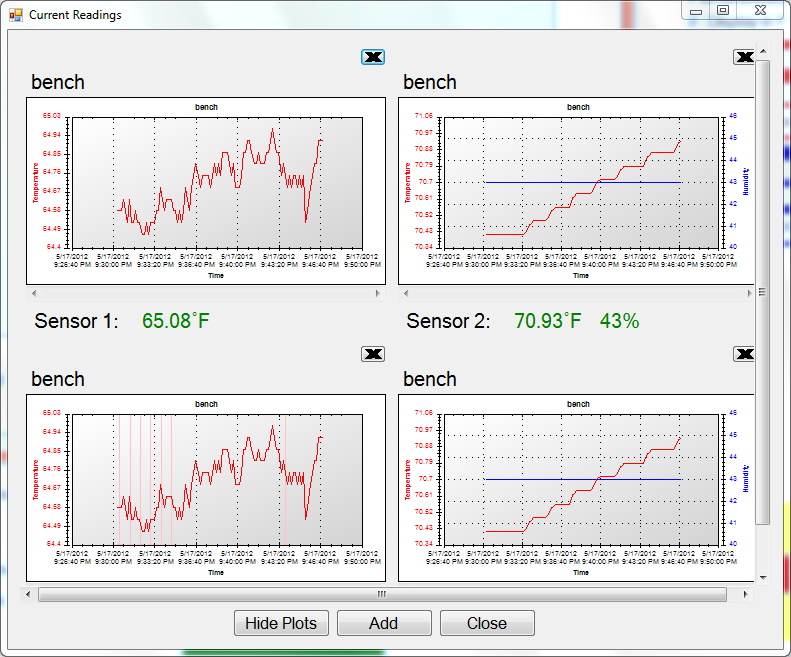
The status screen shows all four sensor readings
Saves time and money
The paperless all electronic chart recorder is a very sophisticated instrument but the user interface is very simple and done with Easy-Touch™. It installs in minutes and requires no special training.
There are no moving parts on this chart recorder to wear out or replace.
No charts or pens to change - ever. You save on the cost of the materials and on the
labor to change them. And, of course, since there are no paper charts,
you save on the file cabinet space to store them. All records are digital
so they are stored in the instrument itself or on your computers. Once
the temperature history is copied to a computer it is stored electronically
as a file on the hard disk. And, of course, you can print out a chart
at any time.
change - ever. You save on the cost of the materials and on the
labor to change them. And, of course, since there are no paper charts,
you save on the file cabinet space to store them. All records are digital
so they are stored in the instrument itself or on your computers. Once
the temperature history is copied to a computer it is stored electronically
as a file on the hard disk. And, of course, you can print out a chart
at any time.
Months of data can be seen at once on the Display
A continuous chart is always visible on the large display of the chart recorder. 1.5 years of temperature history is saved and displayed for each sensor if temperature is sampled every ten minutes. A zoom feature lets you literally look at 1.5 years of recorded data on one screen.
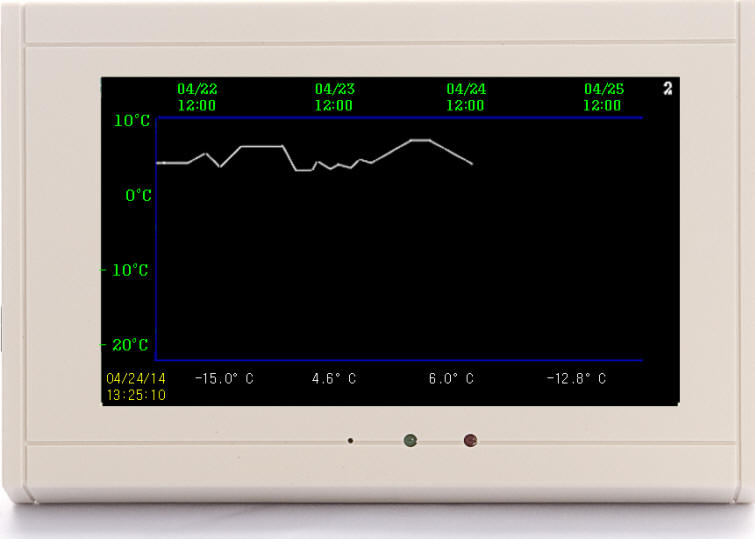
The chart is displayed right on the TV2 Chart Recorder
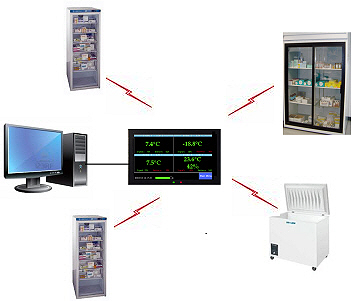
One TV2 Chart Recorder monitors four different sources"
Multiple displays
This Easy-Touch™TV2 chart recorder highlights your recorded data on the display screen.
1. The status display provides a quick look at each of your sensors.
2. Temperature history chart. Touch any temperature and to see the chart for that sensor. One glance is all that is needed to see what happened over the last day or two. Any alarms or unusual readings will stick out, and be immediately apparent.
3. Use the zoom-out function to see a big picture of your recorded data. Trends show up clearly as you zoom out and see more and more data. You can continue to zoom-out until you see ten times the data, which means that you can see a full year of history if you are logging data every ten minutes.
4. The trace mode lets you step through the chart to see every individual temperature reading. The time and day the reading was taken is shown along with the actual reading.
Alarms with siren/strobe or dialer
The chart recorder's on-board relay closes if the user-set temperature
limits are exceeded, which triggers the internal alarm and flashing screen. If you
are using an optional external alarm it will begin to wail. And if you
are using the optional auto dialer you and several other people receive a phone
call immediately.
exceeded, which triggers the internal alarm and flashing screen. If you
are using an optional external alarm it will begin to wail. And if you
are using the optional auto dialer you and several other people receive a phone
call immediately.
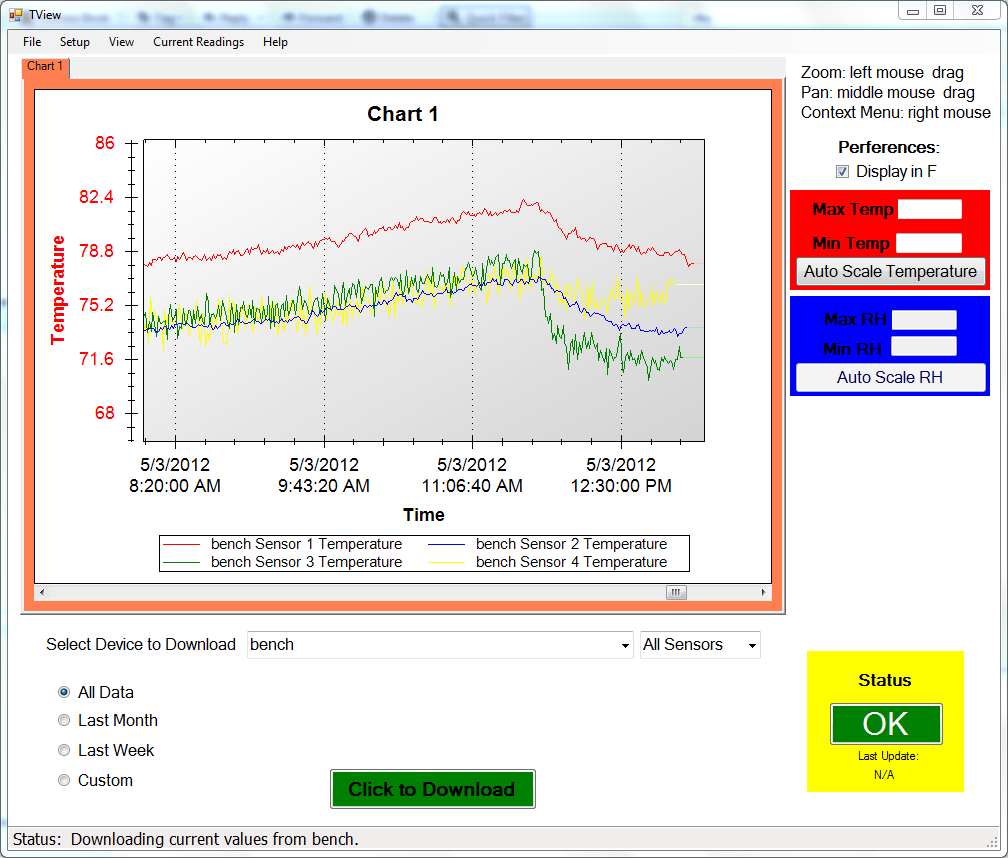
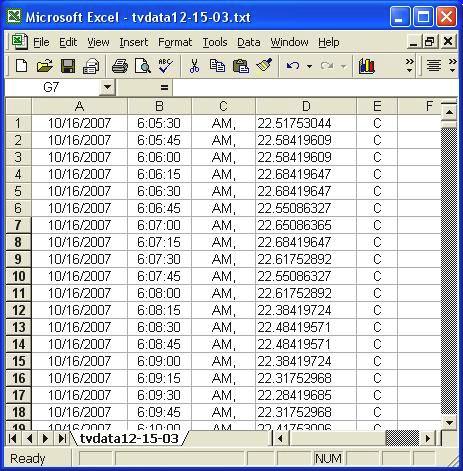
Store temperature history on your computer
The paperless chart recorder holds over over 80,000 data points for each sensorl. All of that data can be downloaded to a computer, and displayed as a chart or in Excel as tabular data. The download program can be set to auto so that the latest data is copied to your computer where it can be accessed by anyone on your network.
Download your chart to your computer
Designed and Manufactured in the USA
©2008 Two Dimensional Instruments, LLC
(modified:October 16, 2019 05:10 PM)